


Convenient meal options continue to drive consumer purchase decisions across the store, and the seafood department is no exception. Prepared seafood posted the second-highest contribution to seafood sales behind fresh seafood, and continued to increase dollar sales during the past year.
During the 52 weeks ending 29 March 2014, prepared seafood’s contribution to total seafood sales remained steady at 17 percent. However, average weekly prepared seafood sales per store increased 2 percent to USD 1,173 (EUR 868.36).
Prepared seafood comprises three categories: meals, surimi seafood and “other” prepared seafood. “Other” prepared seafood (including marinated fish, prepared fish, crustaceans, platters and mollusks) contributed 88.1 percent to prepared-seafood dollar sales, followed by surimi seafood (11.0 percent) and meals (0.9 percent).
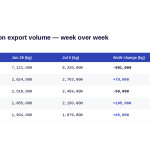
Nationally, each region increased average weekly dollar sales of prepared seafood. The East region had the highest average weekly sales with USD 1,714 (EUR 1,268.86) per store, steady compared to the previous year. The Central region followed with weekly sales of USD 1,221 (EUR 904) per store, an increase of 1.8 percent. The South increased weekly dollar sales 1.8 percent to USD 1,072 (EUR 793.68) per store. The West was the lowest-selling region with USD 914 (EUR 676.69) per store per week, but had the highest growth, up 4.3 percent.
Prepared seafood peaked during late December and early January, as seafood is a popular option during the holidays. The week ending 28 December 2013 posted the highest sales of the latest 52-week period, with USD 2,139 (EUR 1,583.64) per store (up 17.1 percent from the previous year). The lowest-selling week for prepared seafood occurred the week ending 28 September 2013, with sales of USD 962 (EUR 712.24) per store, still an increase of 5.9 percent.
Within prepared seafood, “other” prepared seafood drove growth with a 2.3 percent increase in weekly dollar sales per store. The prepared fish sub-category within “other” prepared seafood drove growth, up 9.6 percent compared to the prior year. The meals sub-category decreased dollars 6.7 percent while the surimi seafood category remained steady compared to the previous year. Prepared seafood meals dollars decreased in all sub-categories except scallop meals and shrimp meals. Surimi seafood posted growth from each sub-category, with the highest percent growth from imitation lobster, up 11.6 percent.
This sales review is provided by Nielsen Perishables Group. Based in Chicago, Nielsen Perishables Group specializes in retail measurement, analytics, marketing communications, category development, promotional best practices and shopper insights. For more information, contact Nielsen Perishables Group: Haley Hastings, 773.929.7013; [email protected].