
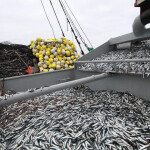





The EU has consolidated its position as the No. 1 consumer of fishery and aquaculture products in the world with last year’s total spend on the products reaching EUR 54 billion (USD 60.1 billion), up 3.2 percent compared 2014 and the highest amount ever recorded. At the same time, the bloc’s per capita consumption has increased to 25.5 kg, which is 1 kg more than in 2013, confirms the latest edition of an annual study compiled by the European Market Observatory for Fisheries and Aquaculture Products (EUMOFA).
The EU’s supply of fishery and aquaculture products grew by almost 650,000 metric tons (MT) to just under 15 million MT in 2014 compared with the previous year, according to “The EU Fish Market – Edition 2016.” The main driver was internal production, which increased by 570,000 MT, mostly originating from fishing activities.
Both farmed and wild production in the EU increased during 2013-2014 – farmed by 2 percent and wild by 11 percent.
Apparent consumption in 2014 increased by 409,000 MT to almost 13 million MT.
Of all the EU member states, Portugal registered the highest per capita consumption of fish and seafood products, although it contracted slightly – from 57.5 kg in 2001 to 55.3 kg in 2014. Nonetheless, in 2014 the Portuguese consumed 30 kg per capita more than the EU average.
The report also finds the self-sufficiency rate – which is the ratio of EU production (catches and aquaculture) to total apparent consumption of the EU market – increased from 44.5 percent to 47.5 percent during 2013-2014, in spite of the consumption increase. A significant part of this rise was linked to the catch increase of species that are not totally landed in the EU, such as tuna and small pelagics. This meant that the EU production was able to keep up with the rise of the internal demand in 2014. However, the top four species consumed in the EU – cod, tuna, salmon and Alaska pollock – represented 32 percent of the market and were mostly or totally imported from third countries.
Norway is the main source of EU seafood imports. In 2015, EU imports from Norway reached 1.5 million MT worth EUR 5.3 billion (USD 5.9 billion), the Scandinavian country’s highest ever import amount. These totals represented increases of 84,600 MT and EUR 448 million (USD 499 million) compared with 2014.
Fresh salmon, which represented 70 percent of the total value of Norway’s imports last year, achieved a value of EUR 3.7 billion (USD 4.1 billion).
While imports from China decreased by 6 percent between 2014 and 2015 – from 513,000 MT to 480,700 MT, the value of this trade grew to more than EUR 1.5 billion (USD 1.7 billion).
Meanwhile, both the value and volume of imports from Iceland grew by 19 percent in 2015, reaching 935,500 MT worth EUR 1.1 billion (USD 1.2 billion). This growth, accompanied by a decline of imports from Ecuador, boosted Iceland to rank third among extra-EU countries of origin.
Iceland’s increase was largely based on its sale of fishmeal to Germany, Denmark and the United Kingdom. In the case of Germany, Iceland’s increase balanced the 90,000 MT decrease in fishmeal Germany purchased from Peru.
Peruvian fishmeal production and exports had dropped with the cancellation of Peru’s second anchovy fishing season in 2014. In addition, China imported the biggest share of Peruvian fishmeal exports.
