
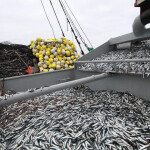




FishSubsidy.org — a project of the Pew Environment Group and EU Transparency — on Monday launched an interactive map on its website allowing Europeans to track EUR 3.4 billion in EU fisheries subsidies.
The map identifies which regions, member states and ports benefited most from fisheries subsidies, illustrating the 39,174 payments made to fishing vessels between 1994 and 2006 under the EU’s Financial Instrument for Fisheries Guidance. Users can select payment types such as vessel construction and modernization to pinpoint the geographical distribution of funding.
The largest subsidy recipients are found in Spain, according to FishSubsidy.org, which opposes the subsidies because it says they lead to fleet overcapacity and overfishing.
“Rather than propping up a subsidies-addicted industry, the EU should invest in conserving valuable fish stocks and securing the future viability of vulnerable fisheries-dependent communities,” said Markus Knigge of the Pew Environment Group.
The map covers payments only up to 2006.
“Unfortunately, the new system of transparency that applies to the European Fisheries Fund is deficient in a number of respects, the most important of which being that data disclosed no longer identifies the vessels for which subsidies were paid,” said Jack Thurston of EU Transparency, a UK-based nonprofit.
All Supply & Trade stories >